Widgets Types
Note
For simplicity's sake we will refer to metrics and charts that are on the dashboard as "widgets"
Widget structure
Charts and metrics are embedded in widgets.
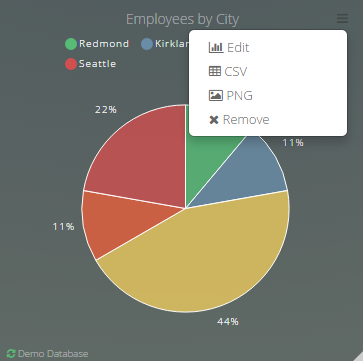
On the header you will find the widget title and options.
The header area is where you click and drag to reposition widgets in the dashboard.
Widget options
- edit widget
- export data to csv
- export chart to png image
- remove widget from dashboard
Note
You can change the format of the CSV file on the Account Settings Page
The footer indicates the widget's data source and allows you to refresh the widget by clicking
Widget Types
To understand how to use the widget types you need to produce a table with values that match the requirements of the specific widget.
To begin, start with Table, then you can easily create other widgets.


Tip
You can reposition the widgets on the dashboard by dragging them by their title
Important Note
Each chart type needs a specific set of measures and/or dimensions and they must obey a particular order
Table #
Displays a table with the columns of your choice.
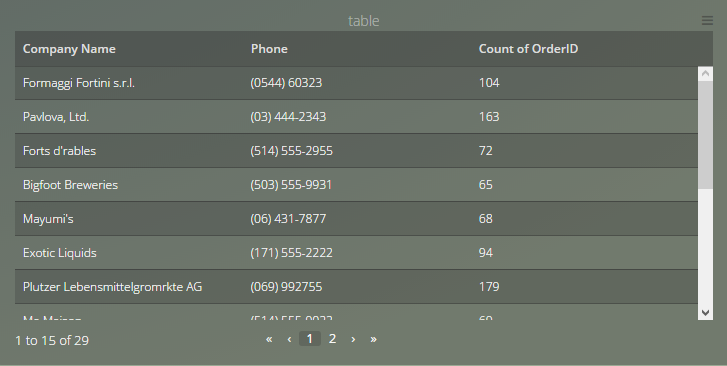
To produce a table you require at least one column of any data type.
This example has three columns:
| Company Name | Phone | Total Orders Supplied |
|---|---|---|
| Formaggi Fortini s.r.l. | (0544) 60323 | 104 |
| Pavlova, Ltd. | (03) 444-2343 | 163 |
| Forts d'rables | (514) 555-2955 | 72 |
| Bigfoot Breweries | (503) 555-9931 | 65 |
| Mayumi's | (06) 431-7877 | 68 |
| Exotic Liquids | (171) 555-2222 | 94 |
| ... | ... | ... |
in Drag & Drop:
To create a table you can add:
Dimensions: for structured labeled information, or also discrete values.
Tip
In this example Dimensions are Company Name and Phone.
Measures: for properties on which calculations can be made, or also continuous values.
Tip
In this example Measures are Total Orders Supplied.
in SQL code:
SELECT "Suppliers"."Company Name" AS "Company Name", "Suppliers"."Phone" AS "Phone", COUNT("Orders"."OrderID") AS "Total Orders Supplied"
FROM "PUBLIC". "Suppliers"
    INNER JOIN "PUBLIC". "Products" ON ("Products"."SupplierID" = "Suppliers"."SupplierID")
    INNER JOIN "PUBLIC". "Order Details" ON ("Order Details"."ProductID" = "Products"."ProductID")
    INNER JOIN "PUBLIC". "Orders" ON ("Order Details"."OrderID" = "Orders"."OrderID")
GROUP BY "Suppliers"."Company Name", "Suppliers"."Phone"
Tips
- If the data is a valid URL, (a text value that starts with http(s)://), a clickable link is automatically generated.
- If there is any text before the URL it will be used for the link name.
- If the URL link, points to a .jpg .jpeg .png .gif image it is automatically shown.
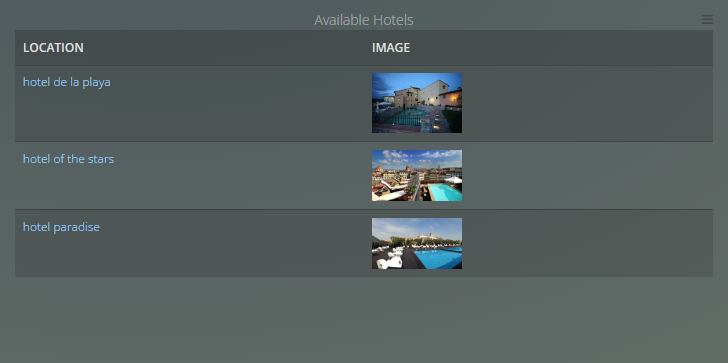
select 'hotel of the stars http://www.hotelofthestars.com' as location, 'https://support.viurdata.com/images/commons/hotel1.jpg' as image
union
select 'hotel paradise http://www.hotelofthestars.com', 'https://support.viurdata.com/images/commons/hotel2.jpg'
union
select 'hotel de la playa http://www.hotelofthestars.com', 'https://support.viurdata.com/images/commons/hotel3.jpg'
Tip
If a column or its alias is named Country or Flag you can see the respective icons.
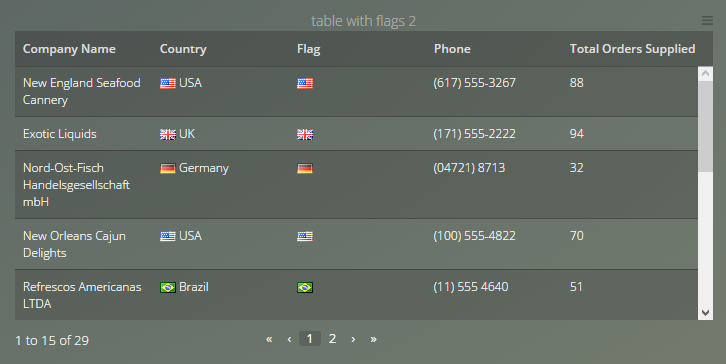
SELECT "Suppliers"."Company Name" AS "Company Name", "Suppliers"."Country" AS "Country", "Suppliers"."Country" AS "Flag", "Suppliers"."Phone" AS "Phone", COUNT("Orders"."OrderID") AS "Total Orders Supplied"
FROM "PUBLIC". "Suppliers"
    INNER JOIN "PUBLIC". "Products" ON ("Products"."SupplierID" = "Suppliers"."SupplierID")
    INNER JOIN "PUBLIC". "Order Details" ON ("Order Details"."ProductID" = "Products"."ProductID")
    INNER JOIN "PUBLIC". "Orders" ON ("Order Details"."OrderID" = "Orders"."OrderID")
GROUP BY "Suppliers"."Company Name", "Suppliers"."Country", "Suppliers"."Phone"
Tip
For more customization options of this Widget click here
Tip
You can format your table elements with specific conditions, click here to see Conditional Formatting.
Note
This widget has a maximum result limit of 100000 rows
Single Value #
The single value displays a value with a label below.

To produce this graphic the table requires:
- One column with one row, can be of any data type: represents the display value.
| Units On Order |
|---|
| 780 |
in Drag & Drop:
To create the columns you need:
- One measure: for the display value.
Tip
The display name is automatically gathered from the column, but you can change it in the widget customization options.
in SQL code:
SELECT SUM("Products"."Units On Order") AS "Units On Order"
FROM "PUBLIC". "Products"
Other example:
You can also display the value using two columns.

To produce this graphic the table requires:
- Two columns
- First column: with one row, can be of any data type: represents the display name.
- Second column: with one row, can be of any data type: represents the display value.
| Product Name | ProductID |
|---|---|
| Alice Mutton | 1 |
in Drag & Drop:
To create two columns you need:
- One measure: for the value
- One dimension: for the label
in SQL code:
SELECT "Products"."Product Name" AS "Product Name", COUNT("Products"."ProductID") AS "ProductID"
FROM "PUBLIC". "Products"
GROUP BY "Products"."Product Name"
LIMIT 1
Tip
For more customization options of this Widget click here
Note
This widget has a maximum result limit of 1 rows
Single Value with Indicator #
Similar to the Single Value but with it has a previous value indicator that tells the percentage between two values.

To produce this graphic the table requires:
- Two columns:
- First column: with one row, must be numeric: represents the previous value.
- Second column: with one row, must be numeric: represents the current value.
| Orders 2014 | Orders 2015 |
|---|---|
| 408 | 270 |
in Drag & Drop:
To create two columns you need:
- Two measures:
- First measure: to display the previous value.
- Second measure: to display the current value.
Tip
The display name is automatically gathered from the column, but you can change it in the widget customization options.
Or
- One measure: to display the previous value.
- One dimension: to display the current value.
in SQL code:
SELECT (SELECT COUNT("Orders"."OrderID") AS "OrderID"
FROM "PUBLIC". "Orders"
WHERE CAST("Orders"."Order Date" AS DATE) BETWEEN '2014-01-01' AND '2014-12-31') as "Orders 2014", (SELECT COUNT("Orders"."OrderID") AS "OrderID"
FROM "PUBLIC". "Orders"
WHERE CAST("Orders"."Order Date" AS DATE) BETWEEN '2015-01-01' AND '2015-12-31') as "Orders 2015"
Tip
For more customization options of this Widget click here
Note
This widget has a maximum result limit of 2 rows
Gauge Chart #
Gauge chart display a numerical value useful for counting measures, when set to a limit is useful to represent how close we are to our goals.

To produce this graphic the table requires one column, with a second column being optional.
- Fist column: must be numeric: represents the current value of the chart.
Optional:
- Second column: must be numeric: represents the maximum value of the chart.
| Total Orders | Objective |
|---|---|
| 830 | 2.000 |
in Drag & Drop:
To create the column you need:
- One measure: for the current value of the chart.
Tip
If you only select one column, you can set the maximum value in the widget options, this limit takes precedence.
Optional:
- One measure: for the maximum value of the chart.
in SQL code:
SELECT COUNT("Orders"."OrderID") AS "Total Orders" , 2000 as "Objective"
FROM "PUBLIC". "Orders"
Tip
For more customization options of this Widget click here
Note
This widget has a maximum result limit of 2 rows
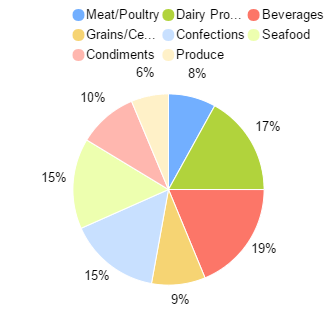
Pie Chart #
Pie charts display numerical proportions for a given set of dimensions.
To produce this graphic the table requires:
- Two columns:
- First column can be of any data type: represents the labels.
- Second column must be numeric: represents the values.
| Category Name | Count of OrderID |
|---|---|
| Meat/Poultry | 173 |
| Dairy Products | 366 |
| Beverages | 404 |
| Grains/Cereals | 196 |
| Confections | 334 |
| Seafood | 330 |
| Condiments | 216 |
| Produce | 136 |
in Drag & Drop:
To create the two columns you need:
- One dimension: for the labels.
- One measure: for the values.
Tip
When using a pie chart try to limit the number of rows/results. Above 10 "slices" the pie chart becomes difficult to read.
Consider the change to a Bar Chart
in SQL code:
SELECT "Categories"."Category Name" AS "Category Name", COUNT("Order Details"."OrderID") AS "Count of OrderID"
FROM "PUBLIC". "Categories"
    INNER JOIN "PUBLIC". "Products" ON ("Products"."CategoryID" = "Categories"."CategoryID")
    INNER JOIN "PUBLIC". "Order Details" ON ("Order Details"."ProductID" = "Products"."ProductID")
GROUP BY "Categories"."Category Name"
Tip
For more customization options of this Widget click here
Note
This widget has a maximum result limit of 3000 rows
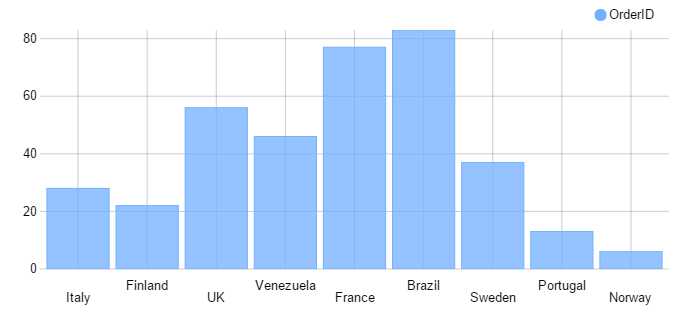
Bar Chart #
A bar chart presents grouped data with rectangular bars with lengths proportional to the values that they represent.
To produce this graphic the table requires:
- Two columns:
- First column can be of any data type: represents the X axis values.
- Second column must be numeric: represents the Y axis values.
| Ship Country | Count of OrderID |
|---|---|
| Italy | 28 |
| Finland | 22 |
| UK | 56 |
| Venezuela | 46 |
| France | 77 |
| Brazil | 83 |
| Sweden | 37 |
| Portugal | 13 |
| Norway | 6 |
in Drag & Drop:
To create the two columns you need:
- One dimension: for the X Axis values.
- One measure: for the Y Axis values.
in SQL code:
SELECT "Orders"."Ship Country" AS "Ship Country", COUNT("Orders"."OrderID") AS "Count of OrderID"
FROM "PUBLIC". "Orders"
GROUP BY "Orders"."Ship Country"
To add Series:
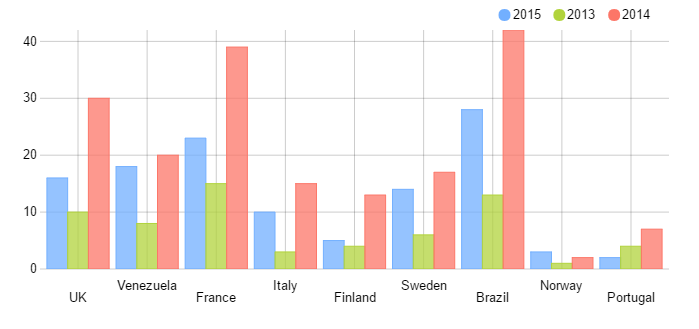
To produce this graphic the table requires:
- Three columns:
- First column can be of any data type: represents the X axis values.
- Second column can be of any data type: represents the Series.
- Third column must be numeric: represents the Y axis values.
| Ship Country | Order Date | Count of OrderID |
|---|---|---|
| Italy | 2013 | 3 |
| France | 2013 | 15 |
| Venezuela | 2013 | 8 |
| Italy | 2014 | 15 |
| Brazil | 2014 | 42 |
| Sweden | 2015 | 14 |
| Portugal | 2015 | 2 |
| UK | 2015 | 16 |
| ... | ... | ... |
in Drag & Drop:
To create the three columns you need:
- Two dimensions:
- First dimension: for the X Axis values.
- Second dimension: for the Series.
- One measure: for the Y Axis values.
in SQL code:
SELECT "Orders"."Ship Country" AS "Ship Country", date_trunc('YEAR',  "Orders"."Order Date") AS "Order Date", COUNT("Orders"."OrderID") AS "Count of OrderID"
FROM "PUBLIC". "Orders"
GROUP BY "Orders"."Ship Country", date_trunc('YEAR',  "Orders"."Order Date")
ORDER BY date_trunc('YEAR',  "Orders"."Order Date") ASC
Tip
For more customization options of this Widget click here
Note
This widget has a maximum result limit of 3000 rows
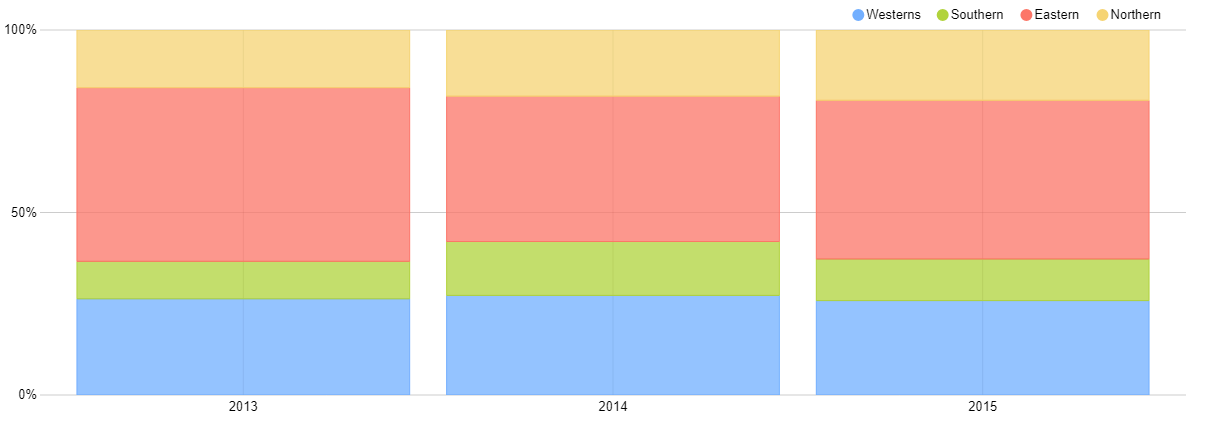
100% Vertical Bar Stacked Chart #
A 100% Vertical Bar Stacked chart presents grouped data with rectangular bars with lengths relative to 100% of the values that they represent.
To produce this graphic you must have Series, the table requires:
- Three columns:
- First column can be of any data type: represents the X axis values.
- Second column can be of any data type: represents the Series.
- Third column must be numeric: represents the Y axis values.
| Order Date | Region Description | OrderID |
|---|---|---|
| 2013 | Westerns | 185 |
| 2014 | Westerns | 525 |
| 2015 | Southern | 152 |
| 2014 | Eastern | 766 |
| 2013 | Eastern | 334 |
| 2013 | Southern | 72 |
| ... | ... | ... |
in Drag & Drop:
To create the three columns you need:
- Two dimensions:
- First dimension: for the X Axis values.
- Second dimension: for the Series.
- One measure: for the Y Axis values.
in SQL code:
SELECT date_trunc('YEAR',  "Orders"."Order Date") AS "Order Date", "Region"."Region Description" AS "Region Description", COUNT("Orders"."OrderID") AS "OrderID"
FROM "Orders"
    INNER JOIN "Employees" ON ("Orders"."EmployeeID" = "Employees"."EmployeeID")
    INNER JOIN "EmployeeTerritories" ON ("EmployeeTerritories"."EmployeeID" = "Employees"."EmployeeID")
    INNER JOIN "Territories" ON ("EmployeeTerritories"."TerritoryID" = "Territories"."TerritoryID")
    INNER JOIN "Region" ON ("Territories"."RegionID" = "Region"."RegionID")
GROUP BY date_trunc('YEAR',  "Orders"."Order Date"), "Region"."Region Description"
Tip
For more customization options of this Widget click here
Note
This widget has a maximum result limit of 3000 rows
Horizontal Bar Chart #
A horizontal bar chart presents grouped data with rectangular bars with lengths proportional to the values that they represent.
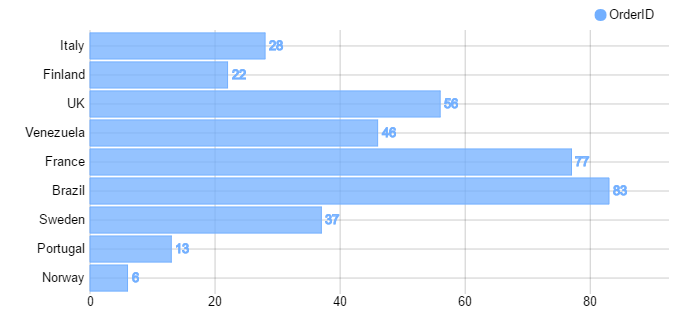
To produce this graphic the table requires:
- Two columns:
- First column can be of any data type: represents the Y axis values.
- Second column must be numeric: represents the X axis values.
| Ship Country | Count of OrderID |
|---|---|
| Italy | 28 |
| Finland | 22 |
| UK | 56 |
| Venezuela | 46 |
| France | 77 |
| Brazil | 83 |
| Sweden | 37 |
| Portugal | 13 |
| Norway | 6 |
in Drag & Drop:
To create the two columns you need:
- One dimension: for the Y Axis values.
- One measure: for the X Axis values.
in SQL code:
SELECT "Orders"."Ship Country" AS "Ship Country", COUNT("Orders"."OrderID") AS "Count of OrderID"
FROM "PUBLIC". "Orders"
GROUP BY "Orders"."Ship Country"
To add Series:
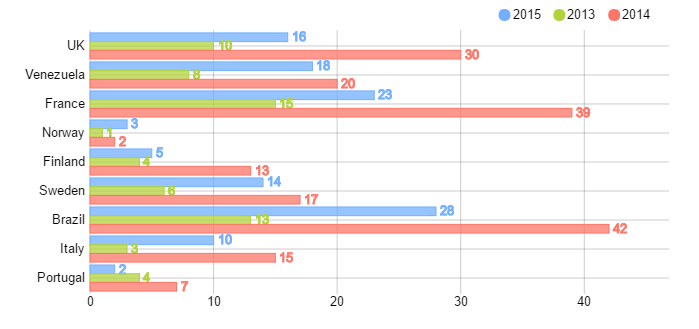
To produce this graphic the table requires:
- Three columns:
- First column can be of any data type: represents the Y axis values.
- Second column can be of any data type: represents the Series.
- Third column must be numeric: represents the X axis values.
| Ship Country | Order Date | Count of OrderID |
|---|---|---|
| Italy | 2013 | 3 |
| France | 2013 | 15 |
| Venezuela | 2013 | 8 |
| Italy | 2014 | 15 |
| Brazil | 2014 | 42 |
| Sweden | 2015 | 14 |
| Portugal | 2015 | 2 |
| UK | 2015 | 16 |
| ... | ... | ... |
in Drag & Drop:
To create the three columns you need:
- Two dimensions:
- First dimension for the Y Axis values.
- Second dimension for the Series.
- One measure: for the X Axis values.
in SQL code:
SELECT "Orders"."Ship Country" AS "Ship Country", date_trunc('YEAR',  "Orders"."Order Date") AS "Order Date", COUNT("Orders"."OrderID") AS "Count of OrderID"
FROM "PUBLIC". "Orders"
GROUP BY "Orders"."Ship Country", date_trunc('YEAR',  "Orders"."Order Date")
ORDER BY date_trunc('YEAR',  "Orders"."Order Date") ASC
Tip
For more customization options of this Widget click here
Note
This widget has a maximum result limit of 3000 rows
Line Chart #
A line chart displays information as a Series of data points called 'markers' connected by straight line segments.
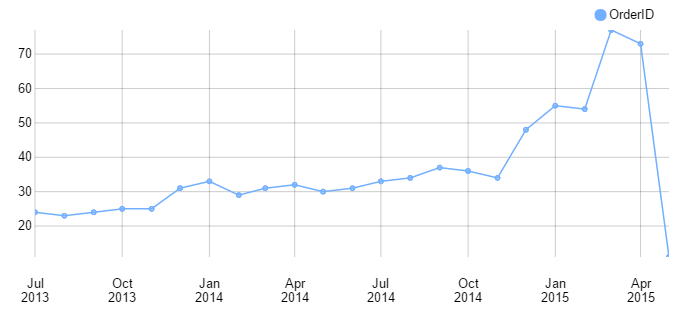
To produce this graphic the table requires:
- Two columns:
- First column: must be date or numeric: represents X axis continuous data.
- Second column: must be numeric: represents the Y axis values.
| Order Date | Count of OrderID |
|---|---|
| Jul 2013 | 24 |
| Aug 2013 | 23 |
| Sep 2013 | 24 |
| Oct 2013 | 25 |
| Nov 2013 | 25 |
| Dec 2013 | 31 |
| ... | ... |
in Drag & Drop:
To create the two columns you need:
- One dimension: for the X Axis values.
- One measure: for the Y Axis values.
in SQL code:
SELECT date_trunc('MONTH',  "Orders"."Order Date") AS "Order Date", COUNT("Orders"."OrderID") AS "Count of OrderID"
FROM "PUBLIC". "Orders"
GROUP BY date_trunc('MONTH',  "Orders"."Order Date")
ORDER BY date_trunc('MONTH',  "Orders"."Order Date") ASC
To add Series:
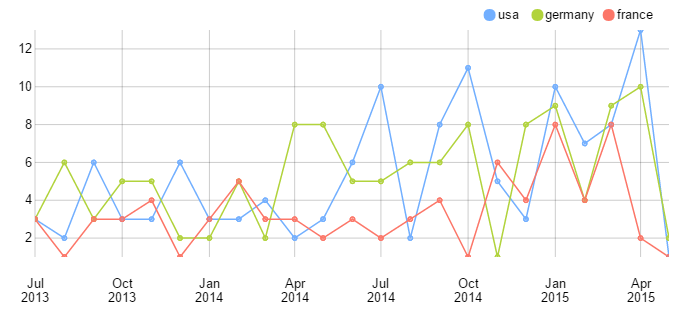
To produce this graphic the table requires:
- Three columns:
- First column: must be date or numeric: represent X axis continuous data.
- Second column: can be of any data type: represents the Series.
- Third column: must be numeric: represents the Y axis values.
| Order Date | Ship Country | Count of OrderID |
|---|---|---|
| Jul 2013 | France | 3 |
| Jul 2013 | USA | 3 |
| Jul 2013 | Germany | 3 |
| Aug 2013 | Germany | 6 |
| Aug 2013 | USA | 2 |
| ... | ... | ... |
in Drag & Drop:
To create the three columns you need:
- Two dimensions:
- First dimension for the X Axis values.
- Second dimension for the Series.
- One measure: for the Y Axis values.
in SQL code:
SELECT date_trunc('MONTH',  "Orders"."Order Date") AS "Order Date", "Orders"."Ship Country" AS "Ship Country", COUNT("Orders"."OrderID") AS "Count of OrderID"
FROM "PUBLIC". "Orders"
GROUP BY date_trunc('MONTH',  "Orders"."Order Date"), "Orders"."Ship Country"
ORDER BY date_trunc('MONTH',  "Orders"."Order Date") ASC
Tip
For more customization options of this Widget click here
Note
This widget has a maximum result limit of 3000 rows
Area Chart #
Area chart displays information as a painted area.

To produce this graphic the table requires:
- Two columns:
- First column: must be date or numeric: represents X axis continuous data.
- Second column: must be numeric: represents the Y axis values.
| Order Date | Count of Ship City |
|---|---|
| 2013 | 152 |
| 2014 | 408 |
| 2015 | 270 |
in Drag & Drop:
To create the two columns you need:
- One dimension: for the X Axis values.
- One measure: for the Y Axis values.
in SQL code:
SELECT date_trunc('YEAR',  "Orders"."Order Date") AS "Order Date", COUNT("Orders"."Ship City") AS "Count of Ship City"
FROM "PUBLIC". "Orders"
GROUP BY date_trunc('YEAR',  "Orders"."Order Date")
ORDER BY date_trunc('YEAR',  "Orders"."Order Date") ASC
To add Series:
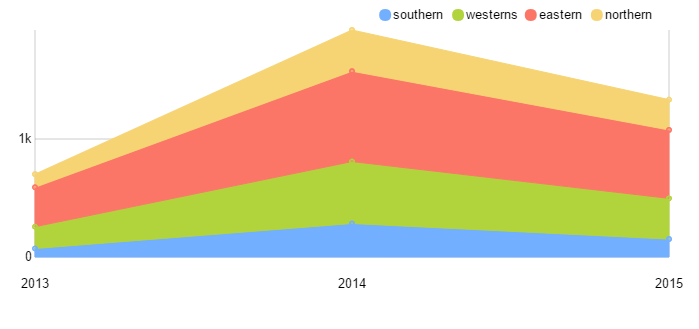
To produce this graphic the table requires:
- Three columns:
- First column: must be date or numeric: represent X axis continuous data.
- Second column: can be of any data type: represents the Series.
- Third column: must be numeric: represents the Y axis values.
| Order Date | Region Description | Count of Ship City |
|---|---|---|
| 2013 | Eastern | 334 |
| 2013 | Northern | 111 |
| 2013 | Southern | 72 |
| 2013 | Westerns | 185 |
| 2014 | Northern | 349 |
| 2014 | Southern | 284 |
| 2014 | Eastern | 766 |
| 2014 | Westerns | 525 |
| 2015 | Northern | 257 |
| 2015 | Westerns | 345 |
| 2015 | Southern | 152 |
| 2015 | Eastern | 580 |
in Drag & Drop:
To create the three columns you need:
- Two dimensions:
- First dimension for the X Axis values.
- Second dimension for the Series.
- One measure: for the Y Axis values.
in SQL code:
SELECT date_trunc('YEAR',  "Orders"."Order Date") AS "Order Date", "Region"."Region Description" AS "Region Description", COUNT("Orders"."Ship City") AS "Count of Ship City"
FROM "PUBLIC". "Orders"
    INNER JOIN "PUBLIC". "Employees" ON ("Orders"."EmployeeID" = "Employees"."EmployeeID")
    INNER JOIN "PUBLIC". "EmployeeTerritories" ON ("EmployeeTerritories"."EmployeeID" = "Employees"."EmployeeID")
    INNER JOIN "PUBLIC". "Territories" ON ("EmployeeTerritories"."TerritoryID" = "Territories"."TerritoryID")
    INNER JOIN "PUBLIC". "Region" ON ("Territories"."RegionID" = "Region"."RegionID")
GROUP BY date_trunc('YEAR',  "Orders"."Order Date"), "Region"."Region Description"
ORDER BY date_trunc('YEAR',  "Orders"."Order Date") ASC
Tip
For more customization options of this Widget click here
Note
This widget has a maximum result limit of 3000 rows
Funnel Chart #
Funnel charts are often used to represent stages in a process and show the amount of loss in each stage.
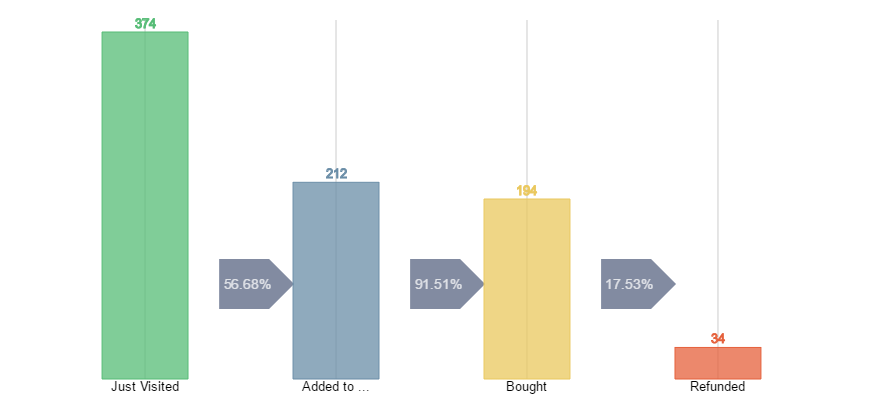
To produce this graphic the table requires:
- Two columns:
- First column can be of any data type: represents the funnel steps.
- Second column must be numeric: represents the step values.
| Actions of Visitors | Number of Users |
|---|---|
| Added to cart | 212 |
| Just Visited | 374 |
| Bought | 194 |
| Refunded | 34 |
in Drag & Drop:
To create the two columns, you have two ways:
- One dimension: for the funnel steps.
One measure: for the step values.
Tip
You have a maximum of 8 row values for the dimension.
Or
At least two measures: the name of the measure for the funnel steps values and the operation of the measure for the step values values.
Tip
You have a maximum of 8 measures.
in SQL code:
SELECT 'Just Visited' AS "Actions of Visitors",  374 AS "Number of Users"
UNION
SELECT 'Added to cart', 212
UNION
SELECT 'Bought', 194
UNION
SELECT 'Refunded', 34
Tip
For more customization options of this Widget click here
Note
This widget has a maximum result limit of 3000 rows
Scatter Chart #
Scatter charts represent points in space to visualize data sets.
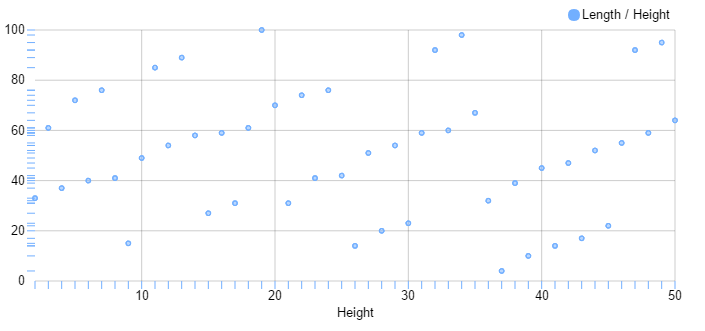
To produce this graphic the table requires:
- Two columns:
- First column: must be numeric: represents the X axis values.
- Second column: must be numeric: represents the Y axis values.
Optional:
- Third column: must be numeric: represents the size of the values.
| Height | Length | Size |
|---|---|---|
| 35 | 68 | 1 |
| 3 | 3 | 1 |
| 33 | 64 | 1 |
| 34 | 33 | 1 |
| 32 | 29 | 1 |
| ... | ... | ... |
in Drag & Drop:
To create the two columns you need:
- Two measures:
- First measure: for the X Axis values.
- Second measure: for the Y Axis values.
Optional:
- Third measure: for the size of the values.
in SQL code:
SELECT 42 as "Height", 53 as "Length", 1 as "Size"
UNION
SELECT 41,4,1
UNION
SELECT 14,32,1
UNION
SELECT 34,75,1
UNION
SELECT 6,18,1
...
To add Series:
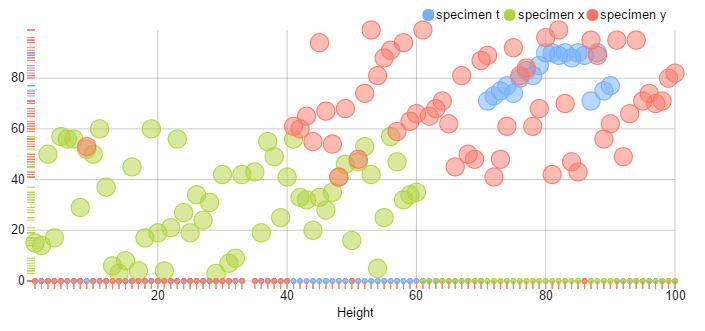
To produce this graphic the table requires:
- Three columns:
- First column: can be any data type: represents the Series.
- Second column: must be numeric: represents the X axis values.
- Third column: must be numeric: represents the Y axis values.
Optional:
- Fourth column: must be numeric: represents the size of the values.
| Type | Height | Lenght | Dot Size |
|---|---|---|---|
| SPECIMEN X | 20 | 55 | 2 |
| SPECIMEN T | 76 | 82 | 2 |
| SPECIMEN Y | 84 | 83 | 2 |
| SPECIMEN X | 51 | 19 | 2 |
| ... | ... | ... | ... |
in Drag & Drop:
To create the two columns you need:
- One dimension: for the Series.
- Two measures:
- First measure: for the X Axis values.
- Second measure: for the Y Axis values.
Optional:
- Fourth measure: for the size of the values.
in SQL code:
SELECT 'SPECIMEN Y' as "Type",9 as "Height",53 as "Lenght",2 as "Dot Size"
UNION
SELECT 'SPECIMEN Y' as "Type",90,98,2
UNION
SELECT 'SPECIMEN Y' as "Type",49,68,2
UNION
SELECT 'SPECIMEN Y' as "Type",95,53,2
...
Tip
For more customization options of this Widget click here
Note
This widget has a maximum result limit of 3000 rows
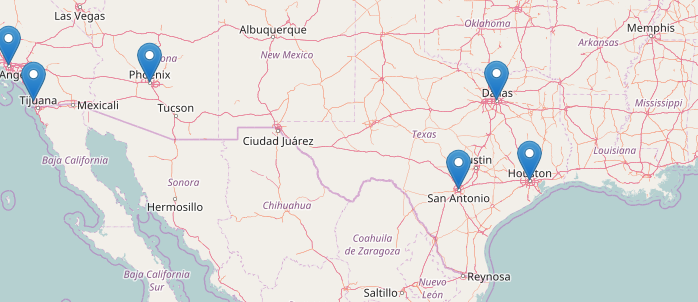
Map Chart #
Map Chart shows a location on the map.
To produce this graphic the table requires:
- Two columns:
- First column must be numeric: represents latitude.
- Second column must be numeric: represents longitude.
Optional:
- Third column can be of any data type: represents label for the coordinate.
- Fourth column must be numeric: represents the size of the marker.
| latitude | longitude | city | population |
|---|---|---|---|
| 32,72 | -117,16 | San Diego | 1.355.896 |
| 32,78 | -96,80 | Dallas | 1.257.676 |
| 33,45 | -112,07 | Phoenix | 1.513.367 |
| 39,95 | -75,17 | Philadelphia | 1.553.165 |
| ... | ... | ... | ... |
in Drag & Drop:
To create the two columns you need:
- Two dimensions:
- First dimension: for latitude: so it can represent the coordinates on the map.
- Second dimension: for longitude: so it can represent the coordinates on the map.
Optional:
- Third dimension for be the labels of the coordinates.
- Fourth dimension for the Heat map signal strength.
in SQL code:
---example not yet available in the demo database
SELECT "Population"."latitude" AS "latitude", "Population"."longitude" AS "longitude", "Population"."city" AS "city", SUM("Population"."population") AS "population"
FROM "PUBLIC". "Population"
GROUP BY "Population"."latitude", "Population"."longitude", "Population"."city"
Tip
For more customization options of this Widget click here
Note
This widget has a maximum result limit of 3000 rows
Viur Utils #
Viur Utils are special Widgets you can use instantly, these Widget are easy and quick to configure like the templates and used as useful utilities.
For now there are these Viur Utils ready to use:
- Embed Web Page: Shows Embed Web page of a URL link.
- Image: Shows an Image based on a URL link.
- Text: Allows to insert text in a Widget.
To create a Util Widget you have add them through Add Widget to Dashboard.

Tip
For more customization options of this Widget click here
Saving the Widgets #
You can quick save you Widgets with the current configuration, alternatively you can Save As for more options.
Saving the widget will add it to your Widgets page and also to your Dashboard if you reached the Widget Creator page through any Dashboard.
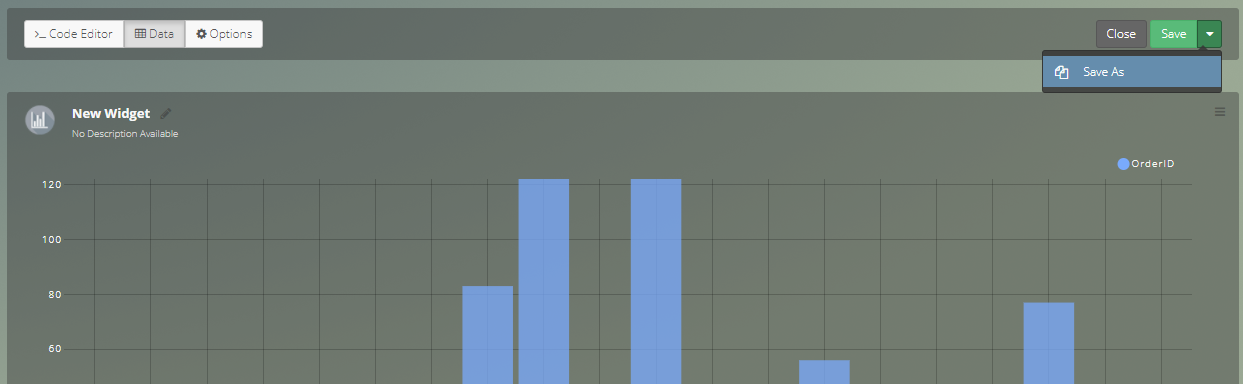
Saving As allows you to save the Widget as carbon a copy of the current Widget, you also have more options like adding a Category or adding to a Dashboard.
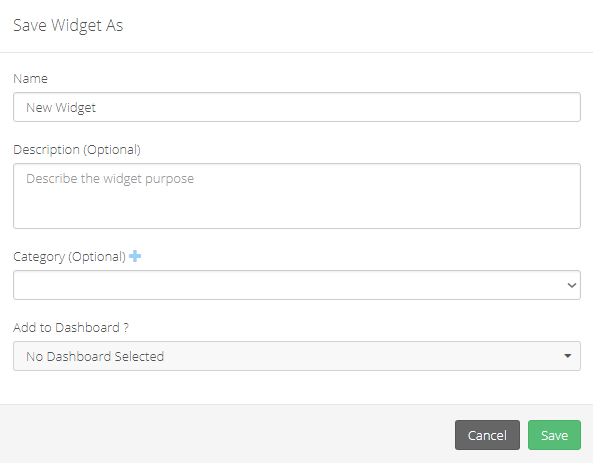
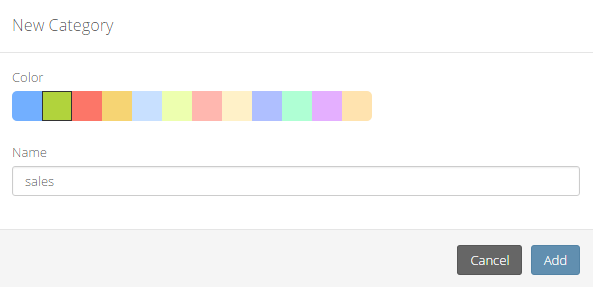
To create a Category to your Widget by clicking on .
You can differentiate them better or it can help you assigning them later to a specific group of users.