Creating Widgets (Drag & Drop)
To create a new Widget go to Widgets (Charts & Metrics) on the navigation bar then click on Create Widget.
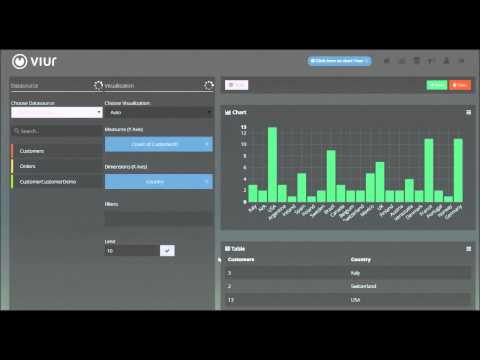
Video walkthrough
Choosing the Data Source
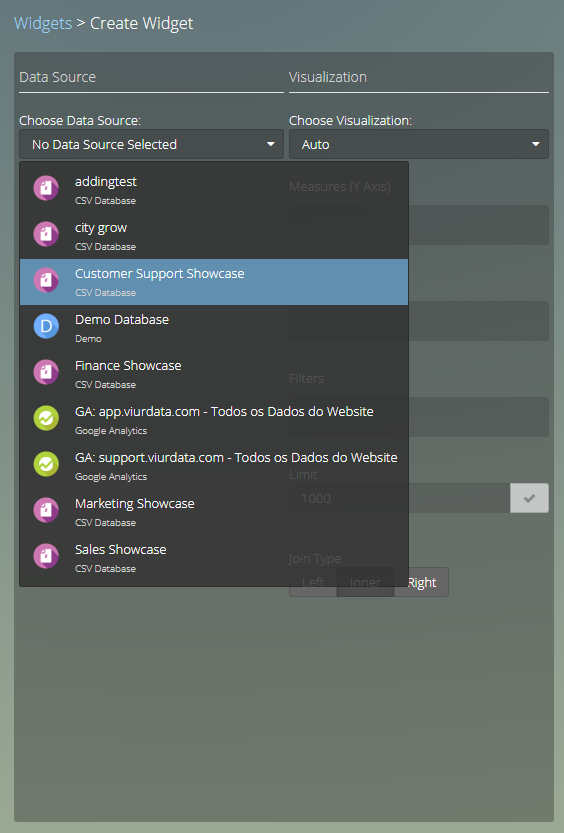
The fist step to create a chart is to select a Data Source (How to connect a Data Source).
Viur handles services the same way it does with databases.
Use the dropdown to select the Data Source you wish to use:
Tip
Use the search bar below the Data Sources dropdown to find a table or column quicker.
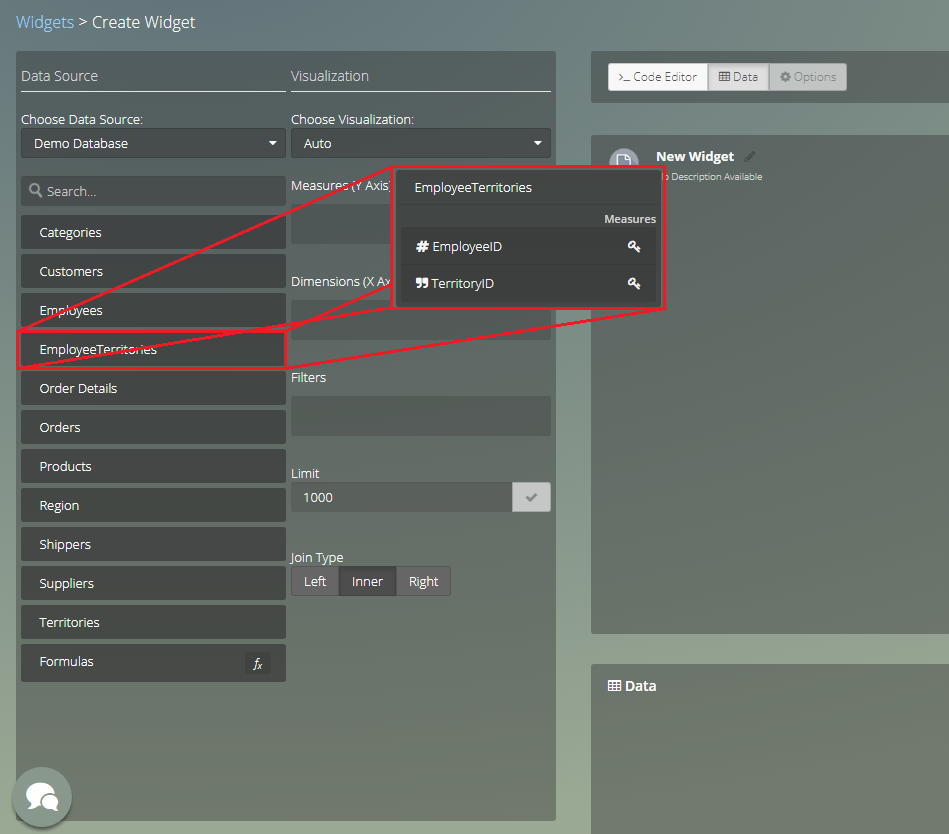
Choosing a Data Source will load it's tables, and by clicking a table it will reveal its columns:
Note
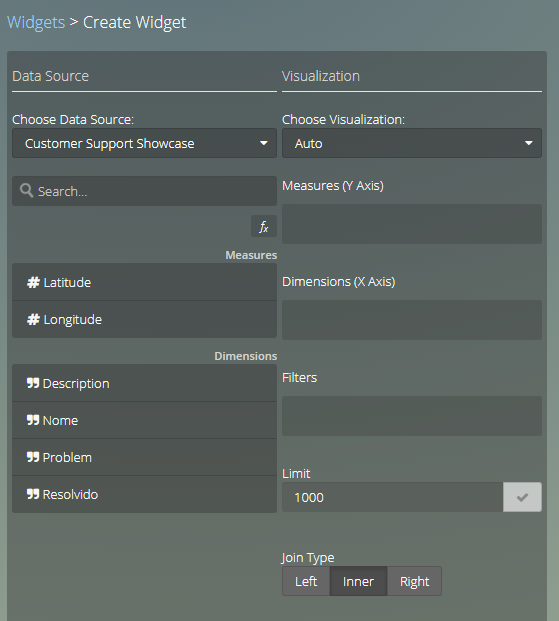
Note that only Data Sources with more than one table are presented this way, single Tabled Data Sources are presented in a flat view like this.
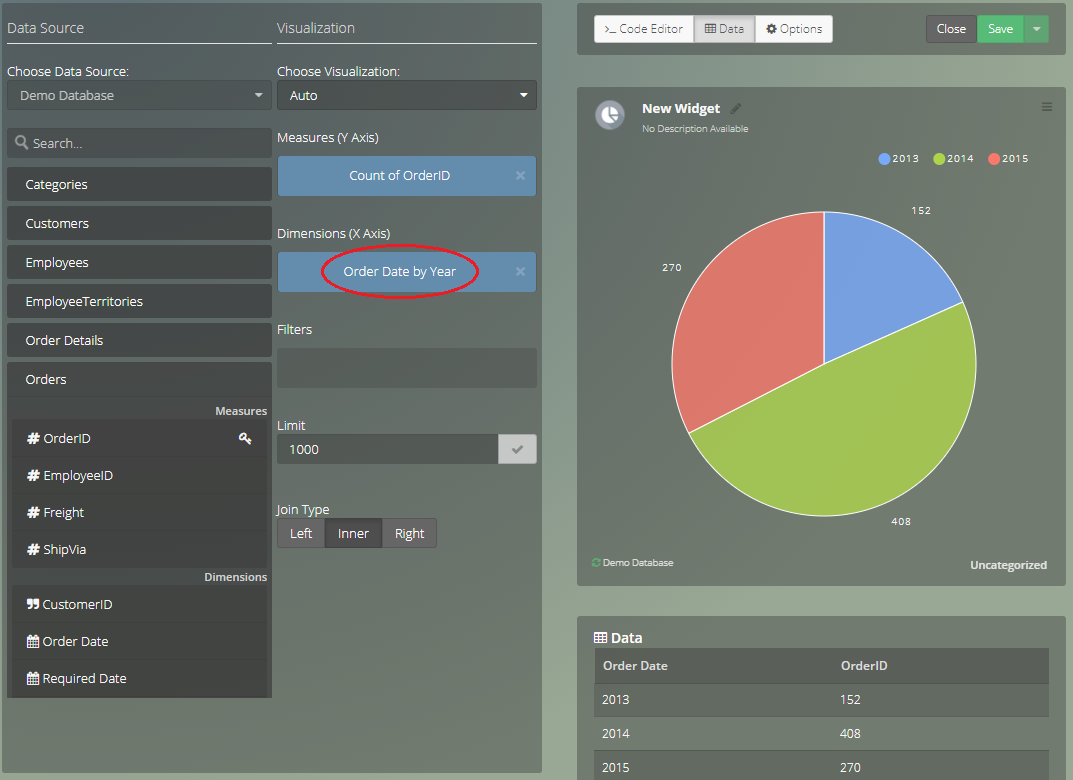
On both "Views" you just need to drag a column and drop it in the Visualization Slots: Measures or Dimensions.
Understanding visualizations #
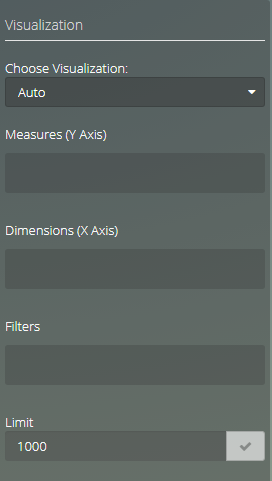
The Visualization area has 5 fields:
Choose Visualization allows you to choose the type of chart. If you leave it in Auto it will show the chart that better suits the data.
Measures is where you drag elements you want to measure
Note
Measure is a property on which calculations (e.g., sum, count, average, minimum, maximum) can be made.Dimensions is where you drag the elements you want to use as label or do groupings.
Note
Dimensions provide structured labeling information to otherwise unordered numeric measures. The dimension is a data set composed of individual, non-overlapping data elements. The primary functions of dimensions are threefold: to provide filtering, grouping and labelling.Filters is where you drag the elements you want to use to filter the results, combined with and expression.
Limit is where you define the maximum number of results to show.
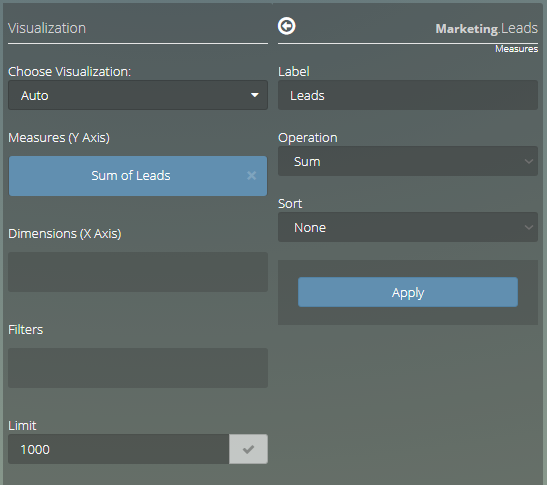
Clicking a element that was dragged into the measures, dimensions or filters will show the options panel.
The options panel has a back button and a label on the header.
The body has a input field for label, and the fields that allow you to aggregate and sort the element.
Joining Tables
If your Database has primary keys and foreign keys well defined Viur takes care of joining tables.
Take a look at this Entity–relationship model:
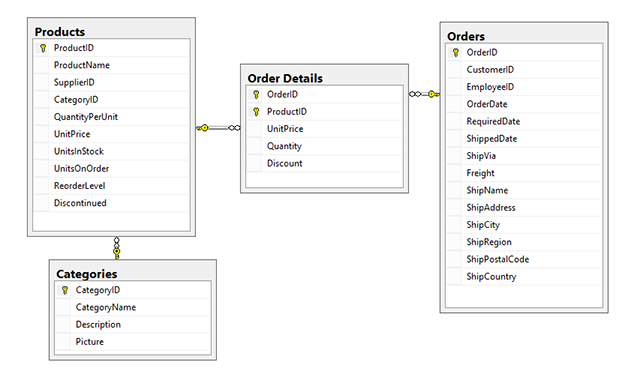
If you were using SQL to get from the table Categories to the table Orders you would have to go through Products and Order Details.
Viur takes care of that for you, so if you would like to see the Categories that were Ordered for a each month you just need something like this:
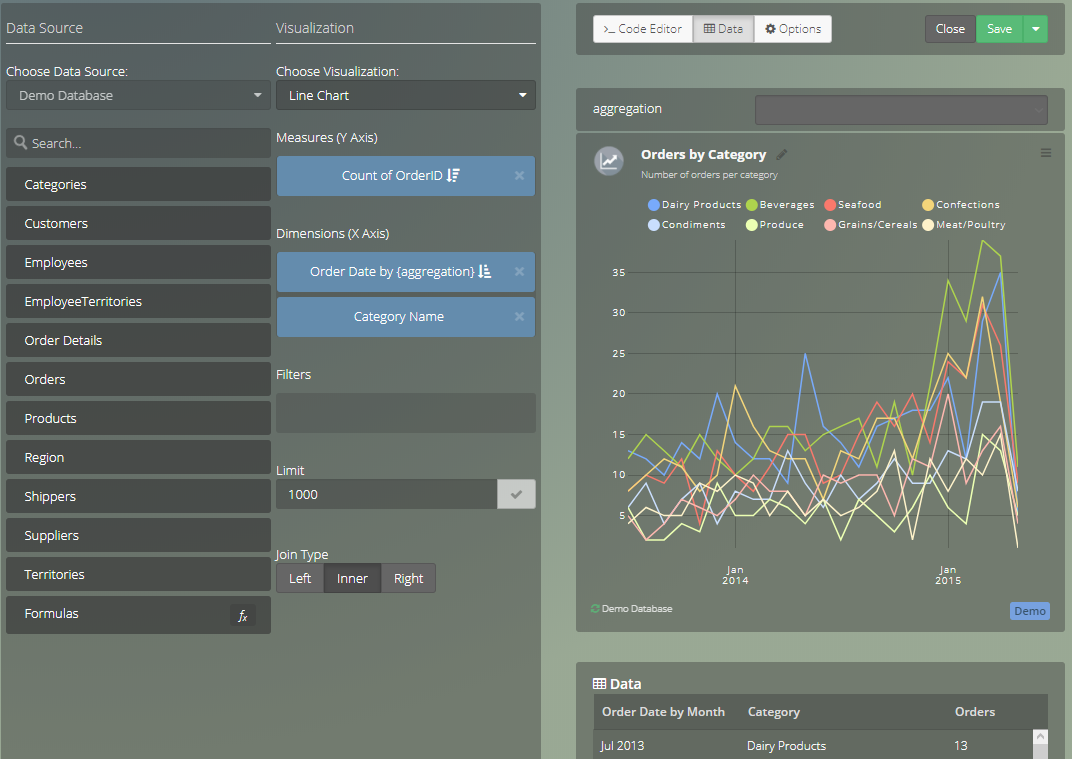
As you can see we just needed to drag three columns:
- from table Orders we dragged Order Date to give us the months where the orders occurred
- from table Categories we dragged Category ID to count the Categories
- from table Categories we dragged Category Name to segment by the Category Name
Editing your measures and dimensions #
After you add columns to your measures and dimensions, you may want additional configuration, like sorting values in a particular order, including or excluding some items.
Depending of the type of the column you will have different configurations.
Here we will approach them, when you click a column name (either it is a Measure, Dimension or Filter):
You can access it's column options:
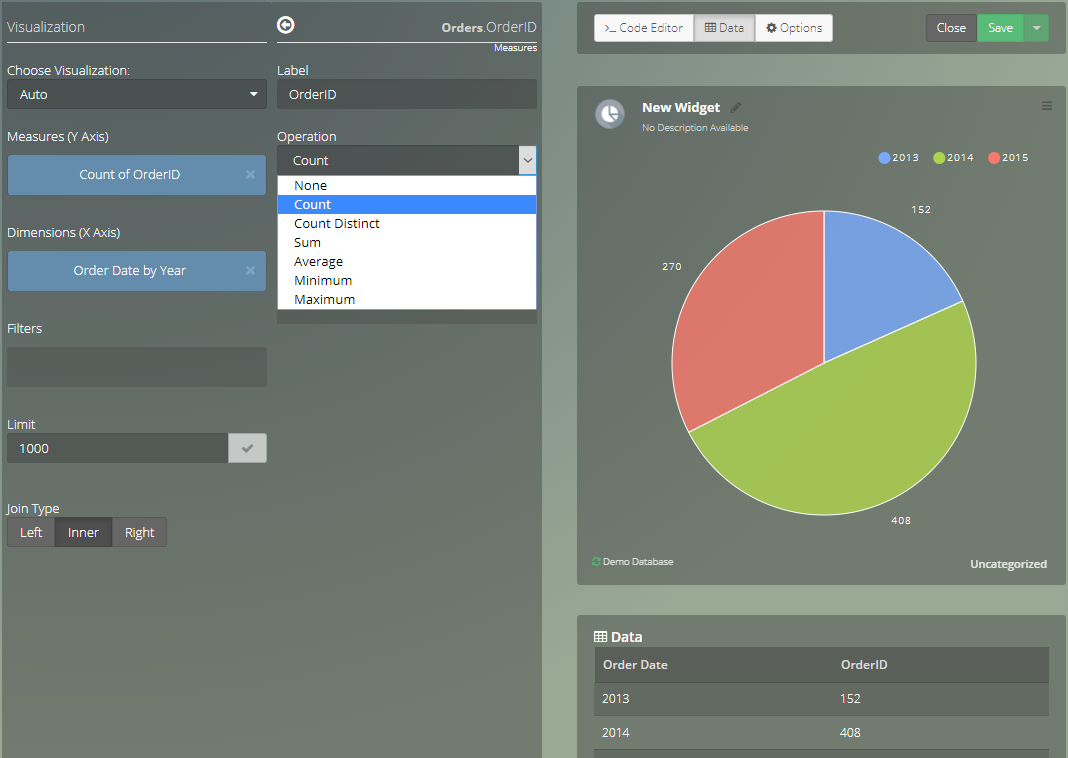
Measures
in a measure column you can customize:
Label
Operation
- Count
- Count Distinct
- Sum
- Average
- Minimum
- Maximum
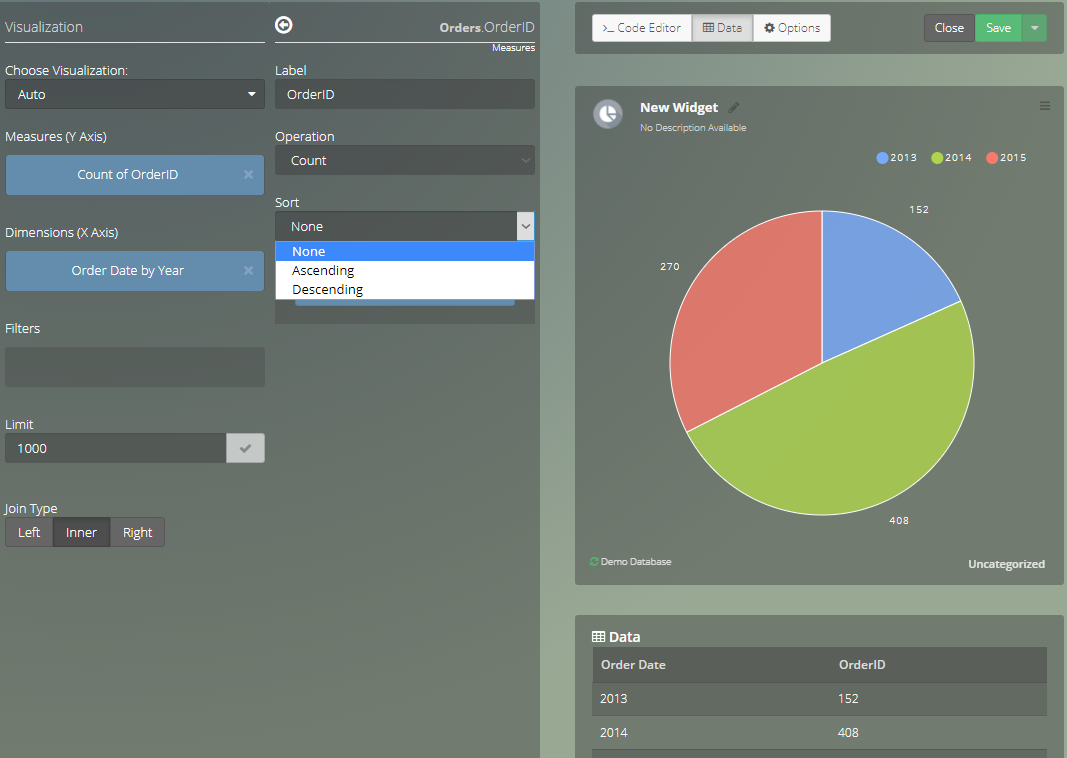
Sort
- Ascending
- Descending
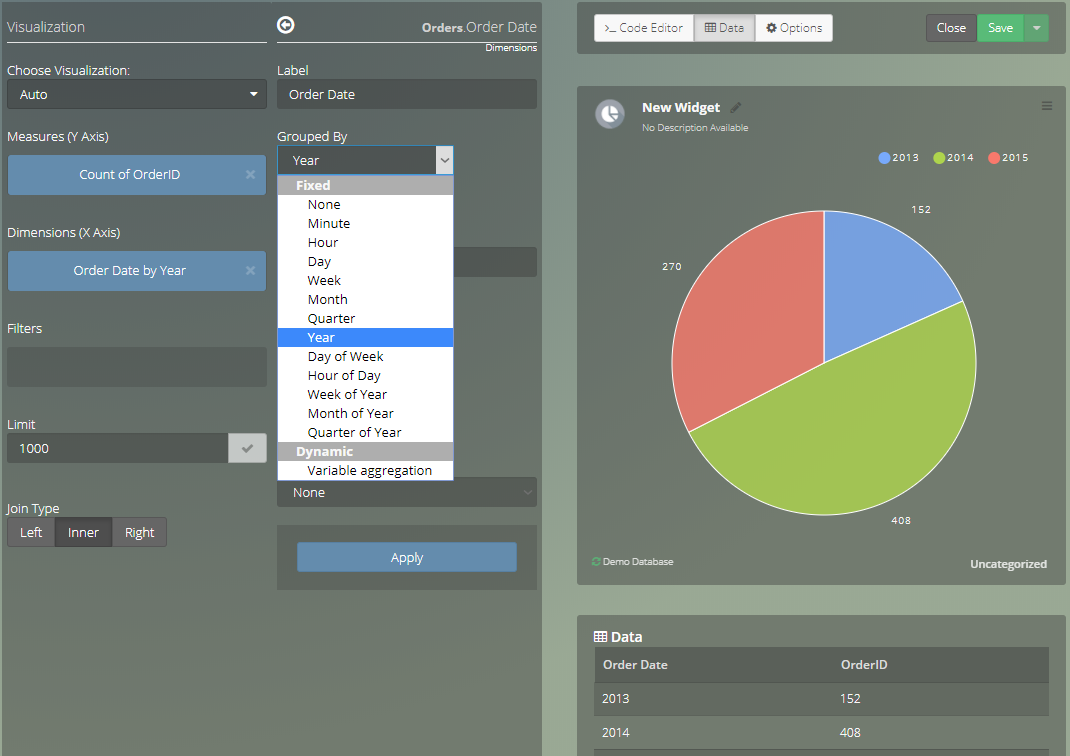
Dimensions
in a dimension column you can customize:
Label
Grouped by
Dates
- None
- Minute
- Hour
- Day
- Week
- Month
- Year
- Day of week
- Hour of day
- Month of year
Numbers
- Buckets
Sort
- Ascending
- Descending
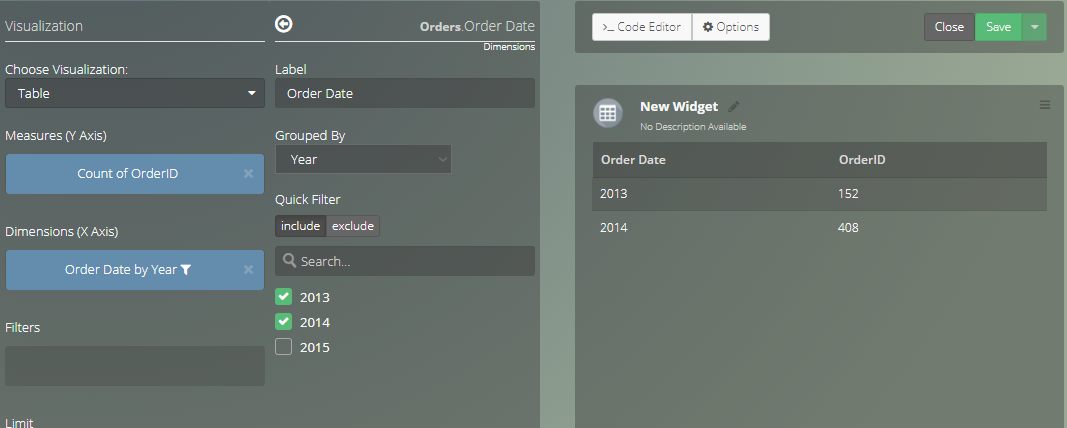
Quick Filters You can apply quick filters directly to a dimension. A filtered dimension will have the icon as a reminder that it has a quick filter applied.
Filters can be inclusive or exclusive.
Filters #
Filters are useful to gather and separate specific information.
In your SQL query they are equal to the WHERE part.
You can drag and drop the column you want to the filter visualization and then click it to open a menu with these options or creating them with SQL code.
Note
To create dynamically changing filters check Creating a new Filter Variable.
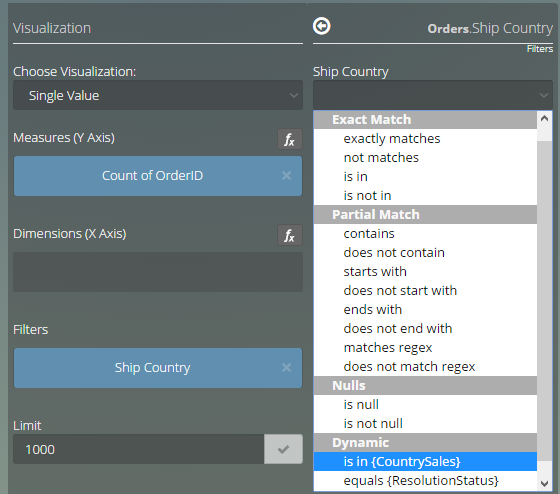
String type columns can be filtered with this properties:
- Exact Match: exactly matches with the string you insert.
- Partial Match: matches if it contains part of the string you insert.
- Nulls: matches if it is null.
- Dynamic: assigns a variable of the dropdown type to this filter, so it can dynamically change based on the variable assigned in the dashboard.
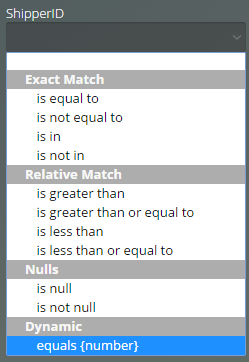
Numeric type columns can be filtered with this properties:
- Exact Match: exactly matches with the number you insert.
- Relative Match: matches if is greater or lesser than the number you insert.
- Nulls: matches if it is null.
- Dynamic: assigns a variable of the dropdown type to this filter, so it can dynamically change based on the variable assigned in the dashboard.
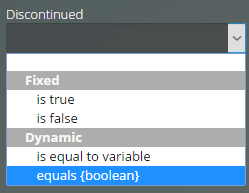
Boolean type columns can be filtered with this properties:
- Nulls: matches if it is null.
- Dynamic: assigns a variable of the dropdown type to this filter, so it can dynamically change based on the variable assigned in the dashboard.
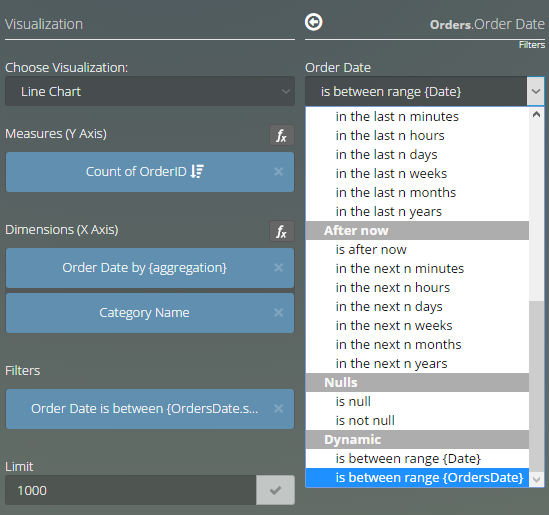
Date type columns can be filtered with this properties:
- Fixed Date: matches between two dates you insert.
- In the present: matches with the current day, week or month you select.
- In the past: matches with the inserted last closed days, weeks, months or years not counting the current day, week, month or year respectively.
- Before now: matches with the inserted number or days, weeks, months or years in the past directly subtracting from the actual day and hour.
- After now: matches with the inserted number or days, weeks, months or years in the future directly adding from the actual day and hour.
- Nulls: matches if it is null.
- Dynamic: assigns a variable of the date range type to this filter, so it can dynamically change based on the variable assigned in the dashboard.
Note
To create dynamically changing filters check Creating a new Filter Variable.