Variables Control
The Variables Control feature allows you to define the Value of any created Variable by clicking directly in the labels, points or values of a Widget.
This feature is only usable with Widgets that are added to a Dashboard, so these configurations are saved in each Dashboard element.
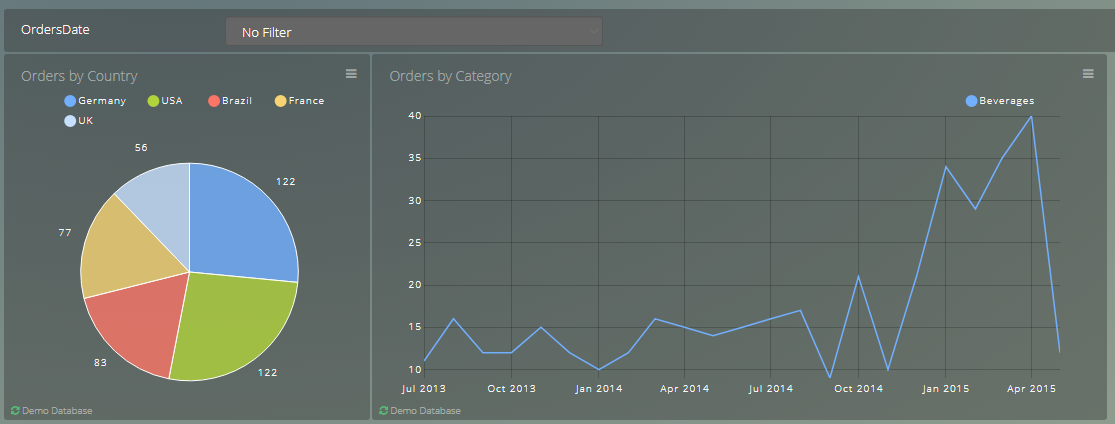
In this example, the Pie Chart on the right has the Variable "Countries" set to obtain the label value when the cursor is clicked on any of its labels.
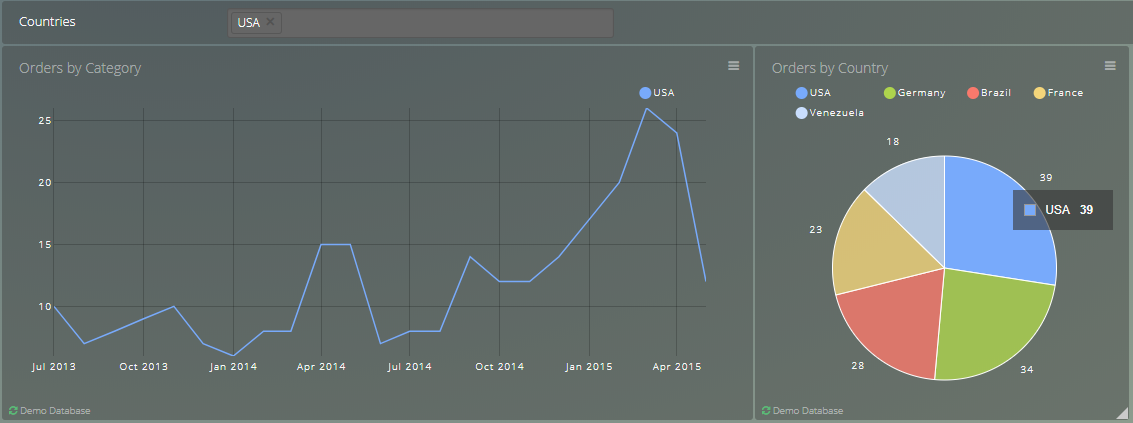
By clicking on the "USA" slice, it will set the Variable Countries to "USA".
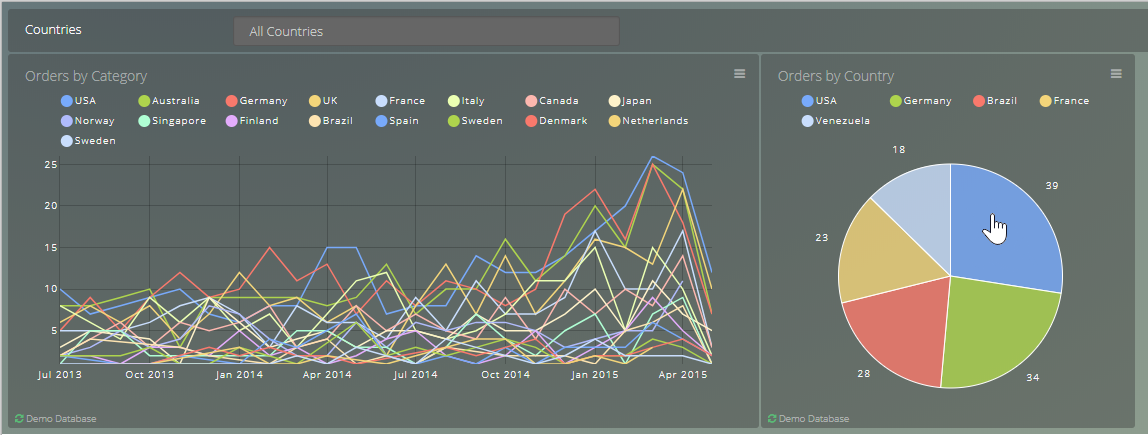
Since the Variable affects the entire Dashboard, all Widgets added to the Dashboard that have Variables will dynamically change.
In this example the Line Chart has dynamically changed accordingly to the value in the Filter Value.
This feature is available for all Widget types.
Note
Analyst users must have Edit Permissions on the Dashboard to create or edit Variables Control.
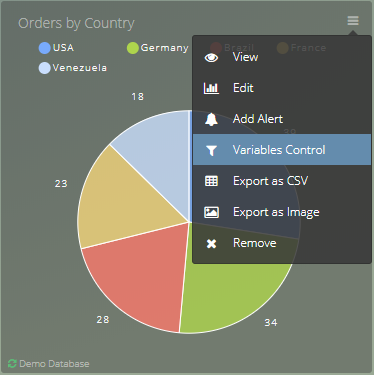
How to add a Variable Control Click #
First step
To prepare a Widget for this feature, it is required to have the Widget within a Dashboard.
Then in the Options choose Variables Control.
Understanding Sources #
When you click a Widget to obtain a Value, that selection will have different sources, which is the various values that can be obtained for the Variable.
Referring the first example: when you click the label USA, you might want your Variable to be the Label (USA) or the Value (39).
Each Chart has its own characteristics that allow different types of sources to be defined as the Values for the Variable:
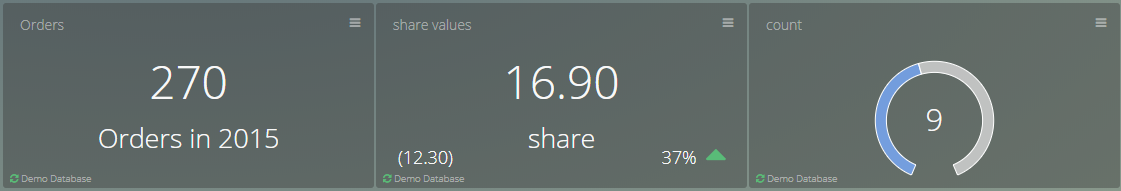
These charts only allow the Source to be their own Value, so if click on these charts your selection can only obtain the correspondent value:
| Chart Type | Sources |
|---|---|
| Single Value | Value: 270 |
| Single Value with Indicator | Value:16.90 |
| Gauge | Value:9 |
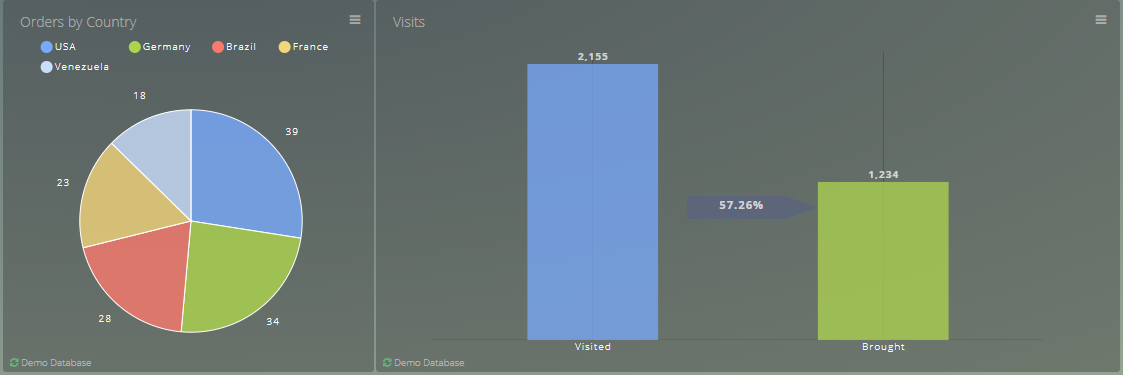
This group of charts allow the Source to be the Label or the Value, so if you click these charts, your selection can be:
| Chart Type | Sources |
|---|---|
| Pie Chart | Label: USA, Value: 39 |
| Funnel Chart | Label: Visited, Value: 2155 |
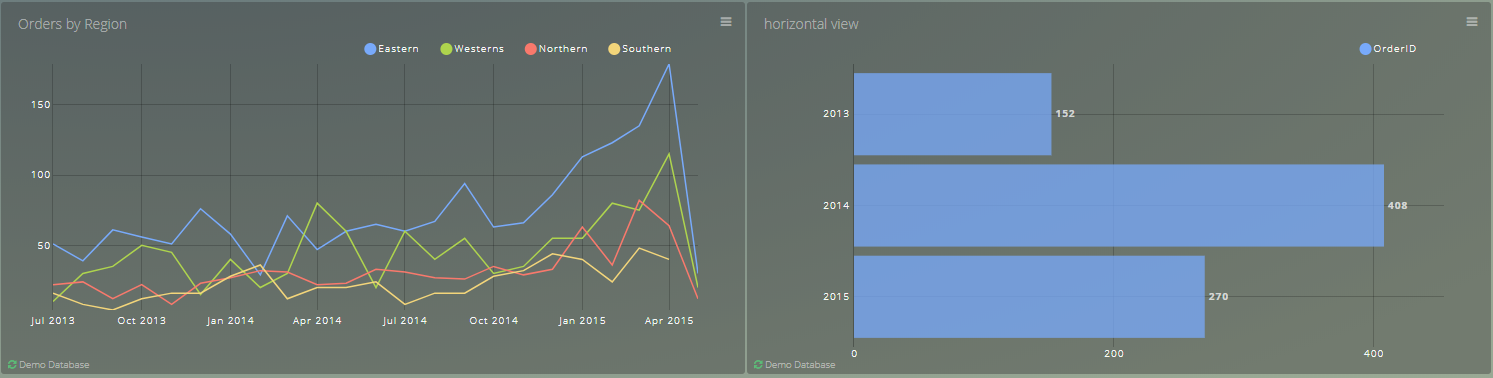
This group of charts allow the Source to be the X Value, Y Value and Series, so if you click these charts, your selection can be:
| Chart Type | Sources |
|---|---|
| Horizontal Bar Chart | X Value: 2015-01-01, Y Value: 270, Series: OrderID |
| Line Chart | X Value: 2014-07-01, Y Value: 8, Series: Southern |
Note
These charts also have the same Source structure:
- Bar Chart
- 100% Vertical Bar Stacked
- Area Chart
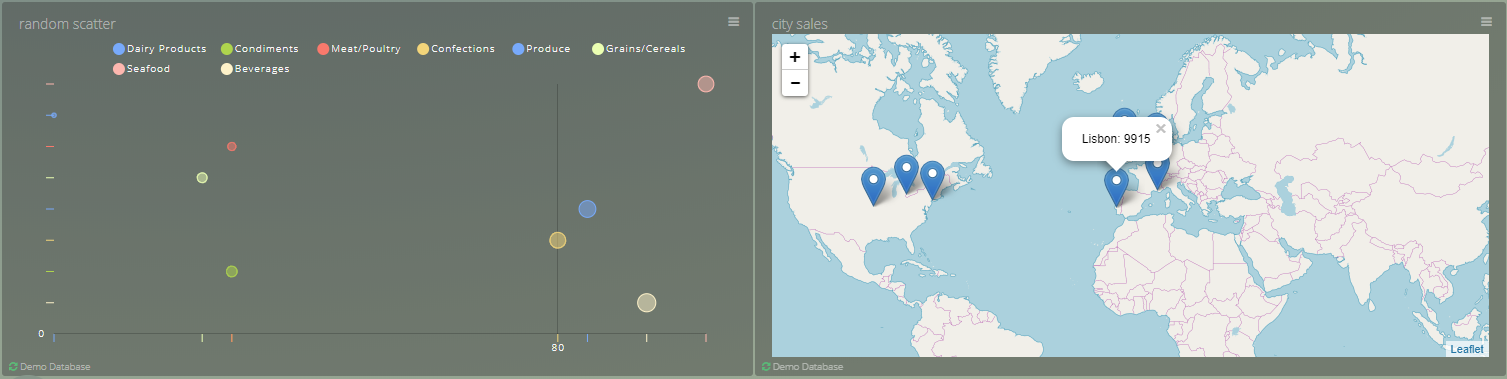
This group of charts allow the Source to be the X Value, Y Value, Series and Size, so if you click these charts, your selection can be:
| Chart Type | Sources |
|---|---|
| Scatter Chart | X Value: 80, Y Value: 50, Series: Confections, Size: 3 |
| Map Chart | X Value: 38.72251, Y Value: -9.139437, Series: Lisbon, Size: 9915 |
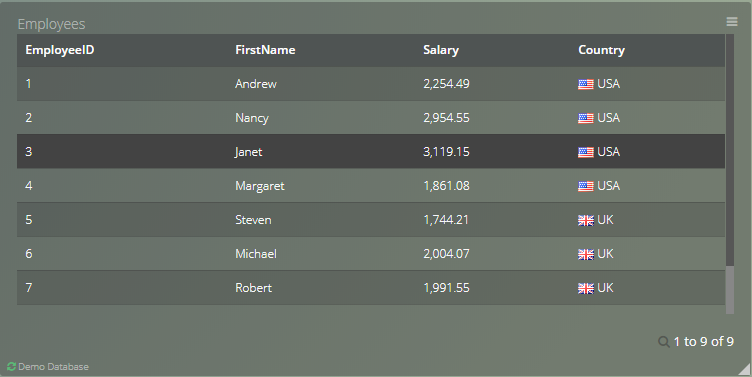
The Table chart is special because it allows all of its Headers to be the Source, so if you click on the highlighted row, your selection can be:
- EmployeeID: 3
- FirstName: Janet
- Salary: 3119.15
- Country: USA
All of the available charts also have 3 more options the Source can be:
- No Effect: Does not alter the Value of a Variable, being it defined or not, the Value or Values stay the same.
- Unset Variable: Forces a Variable to be undefined, making it empty or cleared of Values.
- Custom Value: Allows the User to set their own Value or Values, the Variable will always obtain the same Value.You can set multi values by separating them with a ','.
Second step #
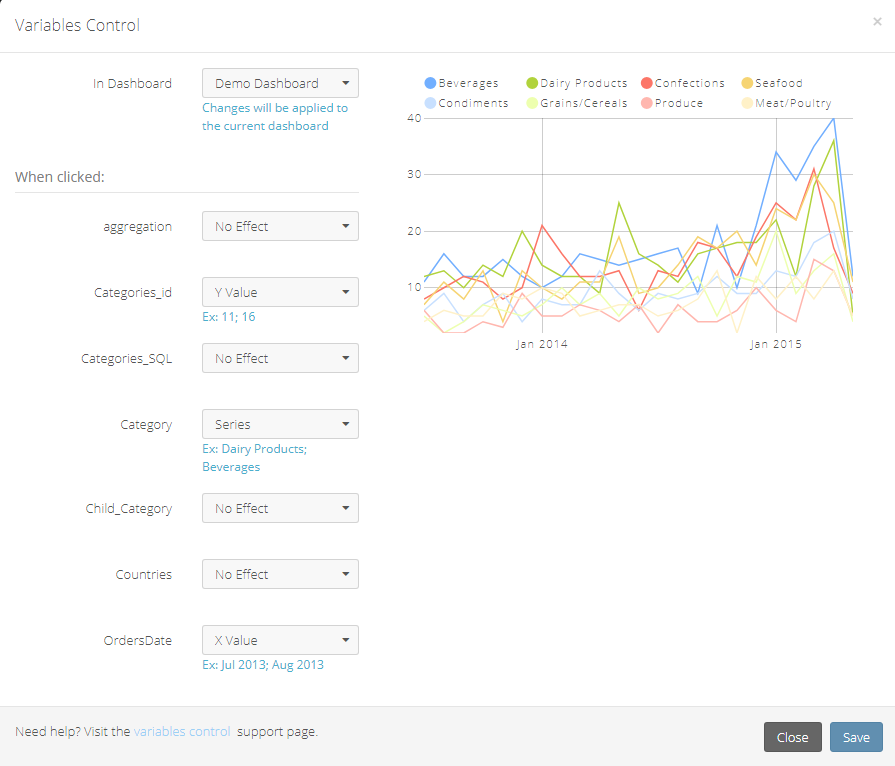
Now that we know all the existing types of sources, you can define which sources are attributed to your Variables.
After you entered the Variables Control you are shown every Variables you have access, when selecting sources you are given an example (Ex:) of the possible values to help visualizing which source you need.
Then you can set up which Variables obtains the Source Value when you click on a Widget.
Note
This Widget configuration will only be set to this Dashboard Element, so this Widget on different and same Dashboards have to be configured separably.
Filtering other Dashboards #
The In Dashboard selection allows you to open other Dashboards with the obtained source values set as the default Variables.
When you are creating or editing a variable control, your current Dashboard is the default target, but if you change the In Dashboard it allows you to choose a different target from your current list of available Dashboards.
Useful for example if you want to view another Dashboard with the Variables set as the same as the values obtained in a Widget.
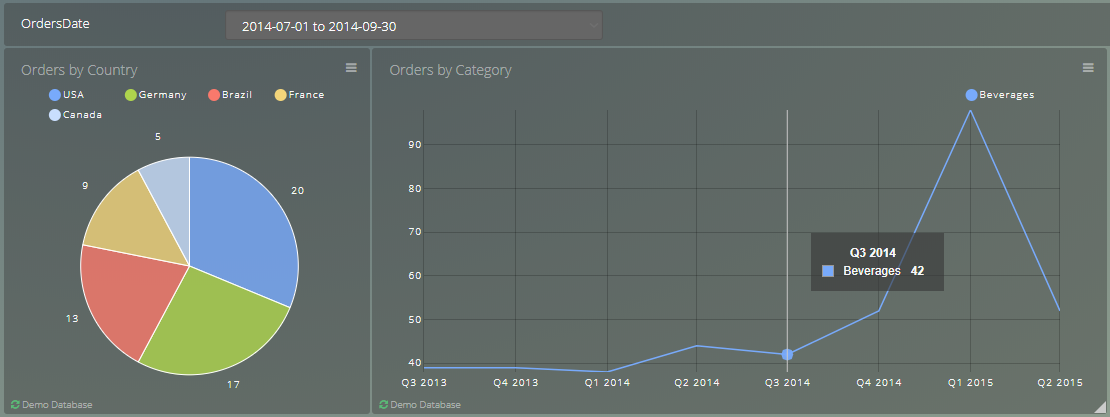
Handling Dates #
If your Variable is of the Date Range type and your Source Value selection is also a date, Viur will automatically choose an appropriate date range based on the Source Value date format.
In this example both the Variable OrdersDate and the X Axis value from Order by Category are of type Date.
OrdersDate is a Variable of the Date Range type and it needs a starting and ending date.
If we set the X Axis to be the Source for the OrdersDate, when we click a point in that Widget, the value of that point is only a single date.
This is where Viur will automatically choose an appropriate date range based on the Source Value date format.
Since the date is aggregated by month, a click in any point of Order by Category will set the end date of OrdersDate to the end of the respective month of the Source Value.
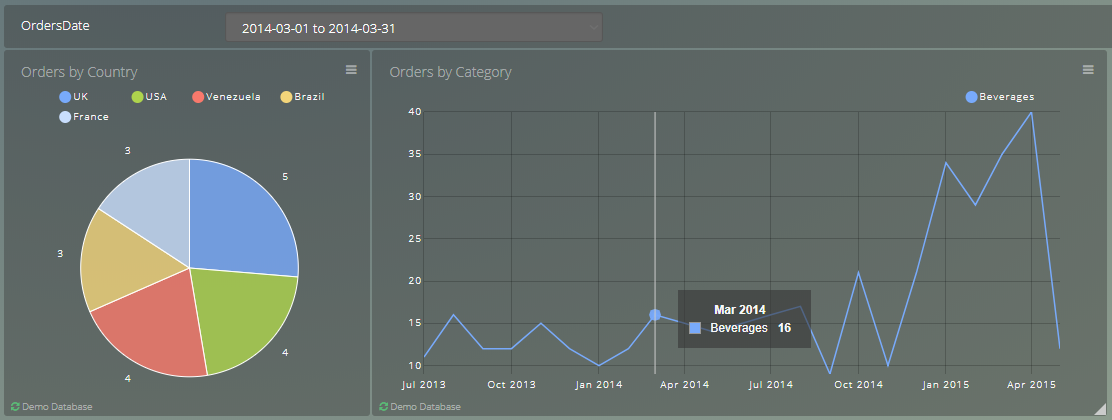
Notice how a click in the point MARCH 2014 sets the start date to 2014-03-01 and the end date to the end of the month 2014-03-31.
Note
This Date Handling property of the Variables Control feature also extends to these aggregations:
- Day
- Week
- Quarter
- Year
Another example, now the date is aggregated by quarter, then the end date is automatically set to the end of the Source Value quarter.